Here is a simple report that you can export from SPOS to help view your performance by brand.
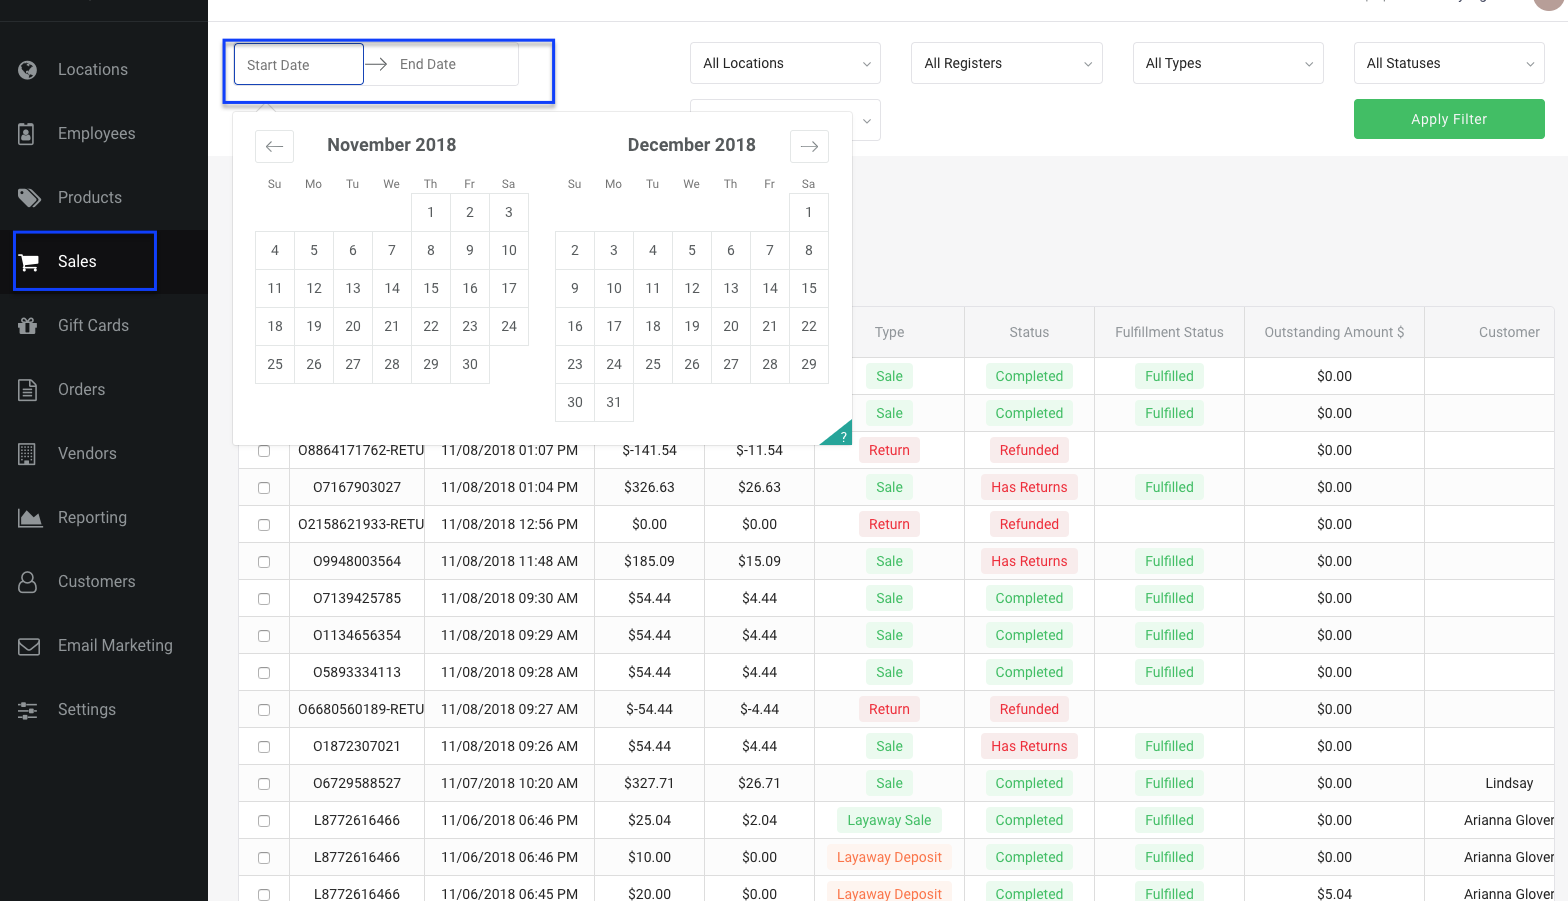
1) Go to the sales dashboard in the SPOS Web App and filter by your desired time range from the "Start Date --> End Date" at the top of the screen and select ![]()
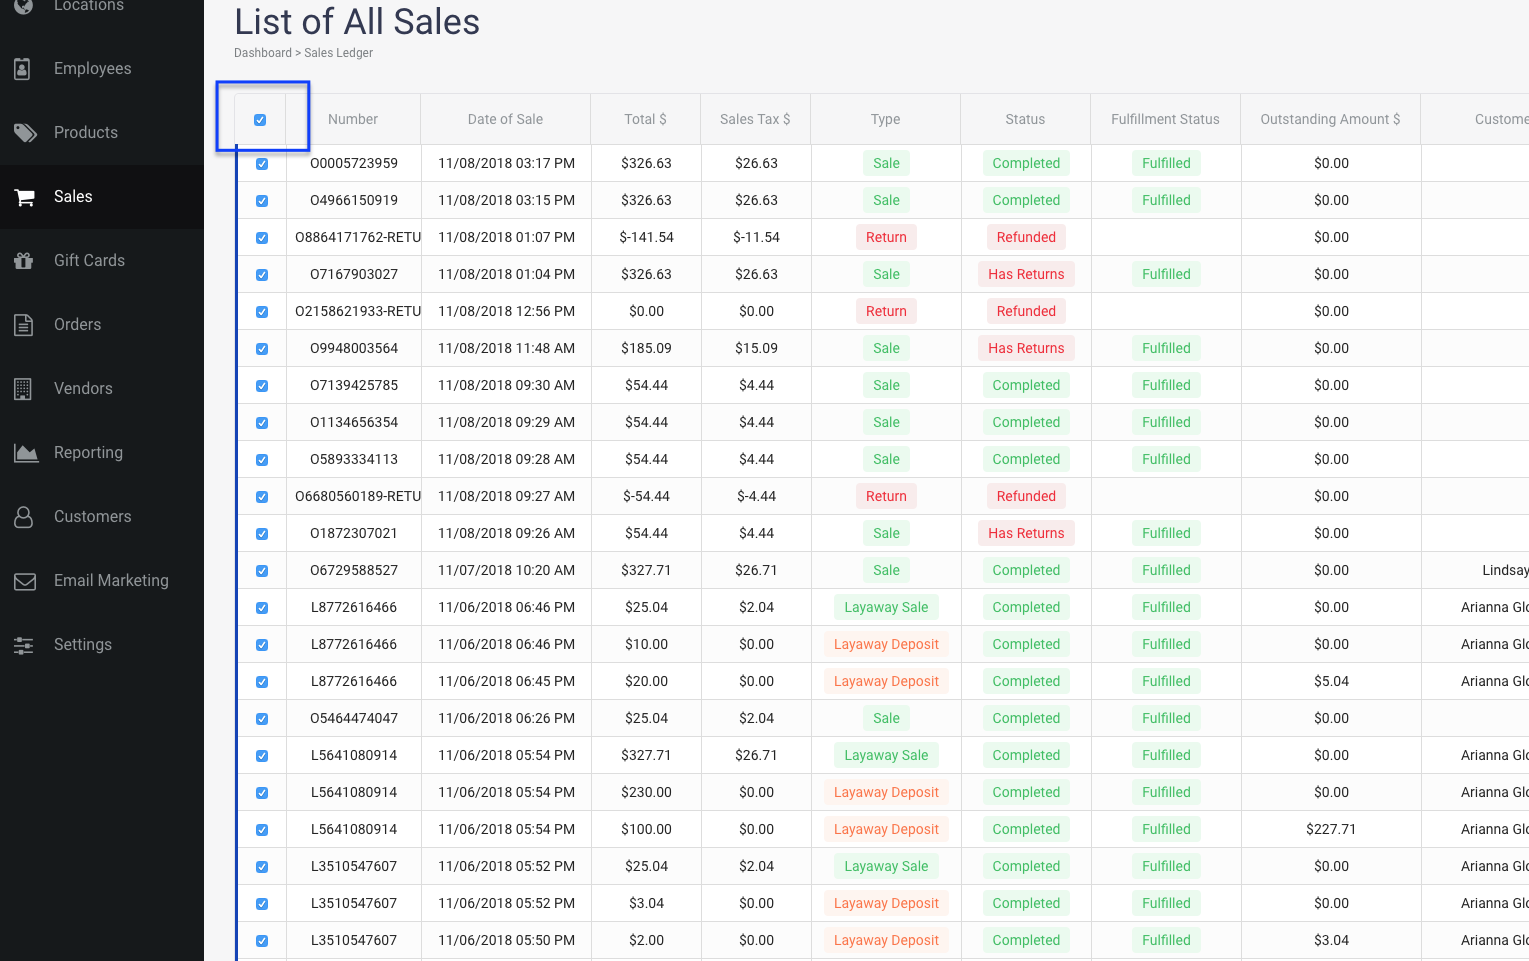
2) Select the checkbox in the title bar to select all. Then scroll to the bottom of the page and select 
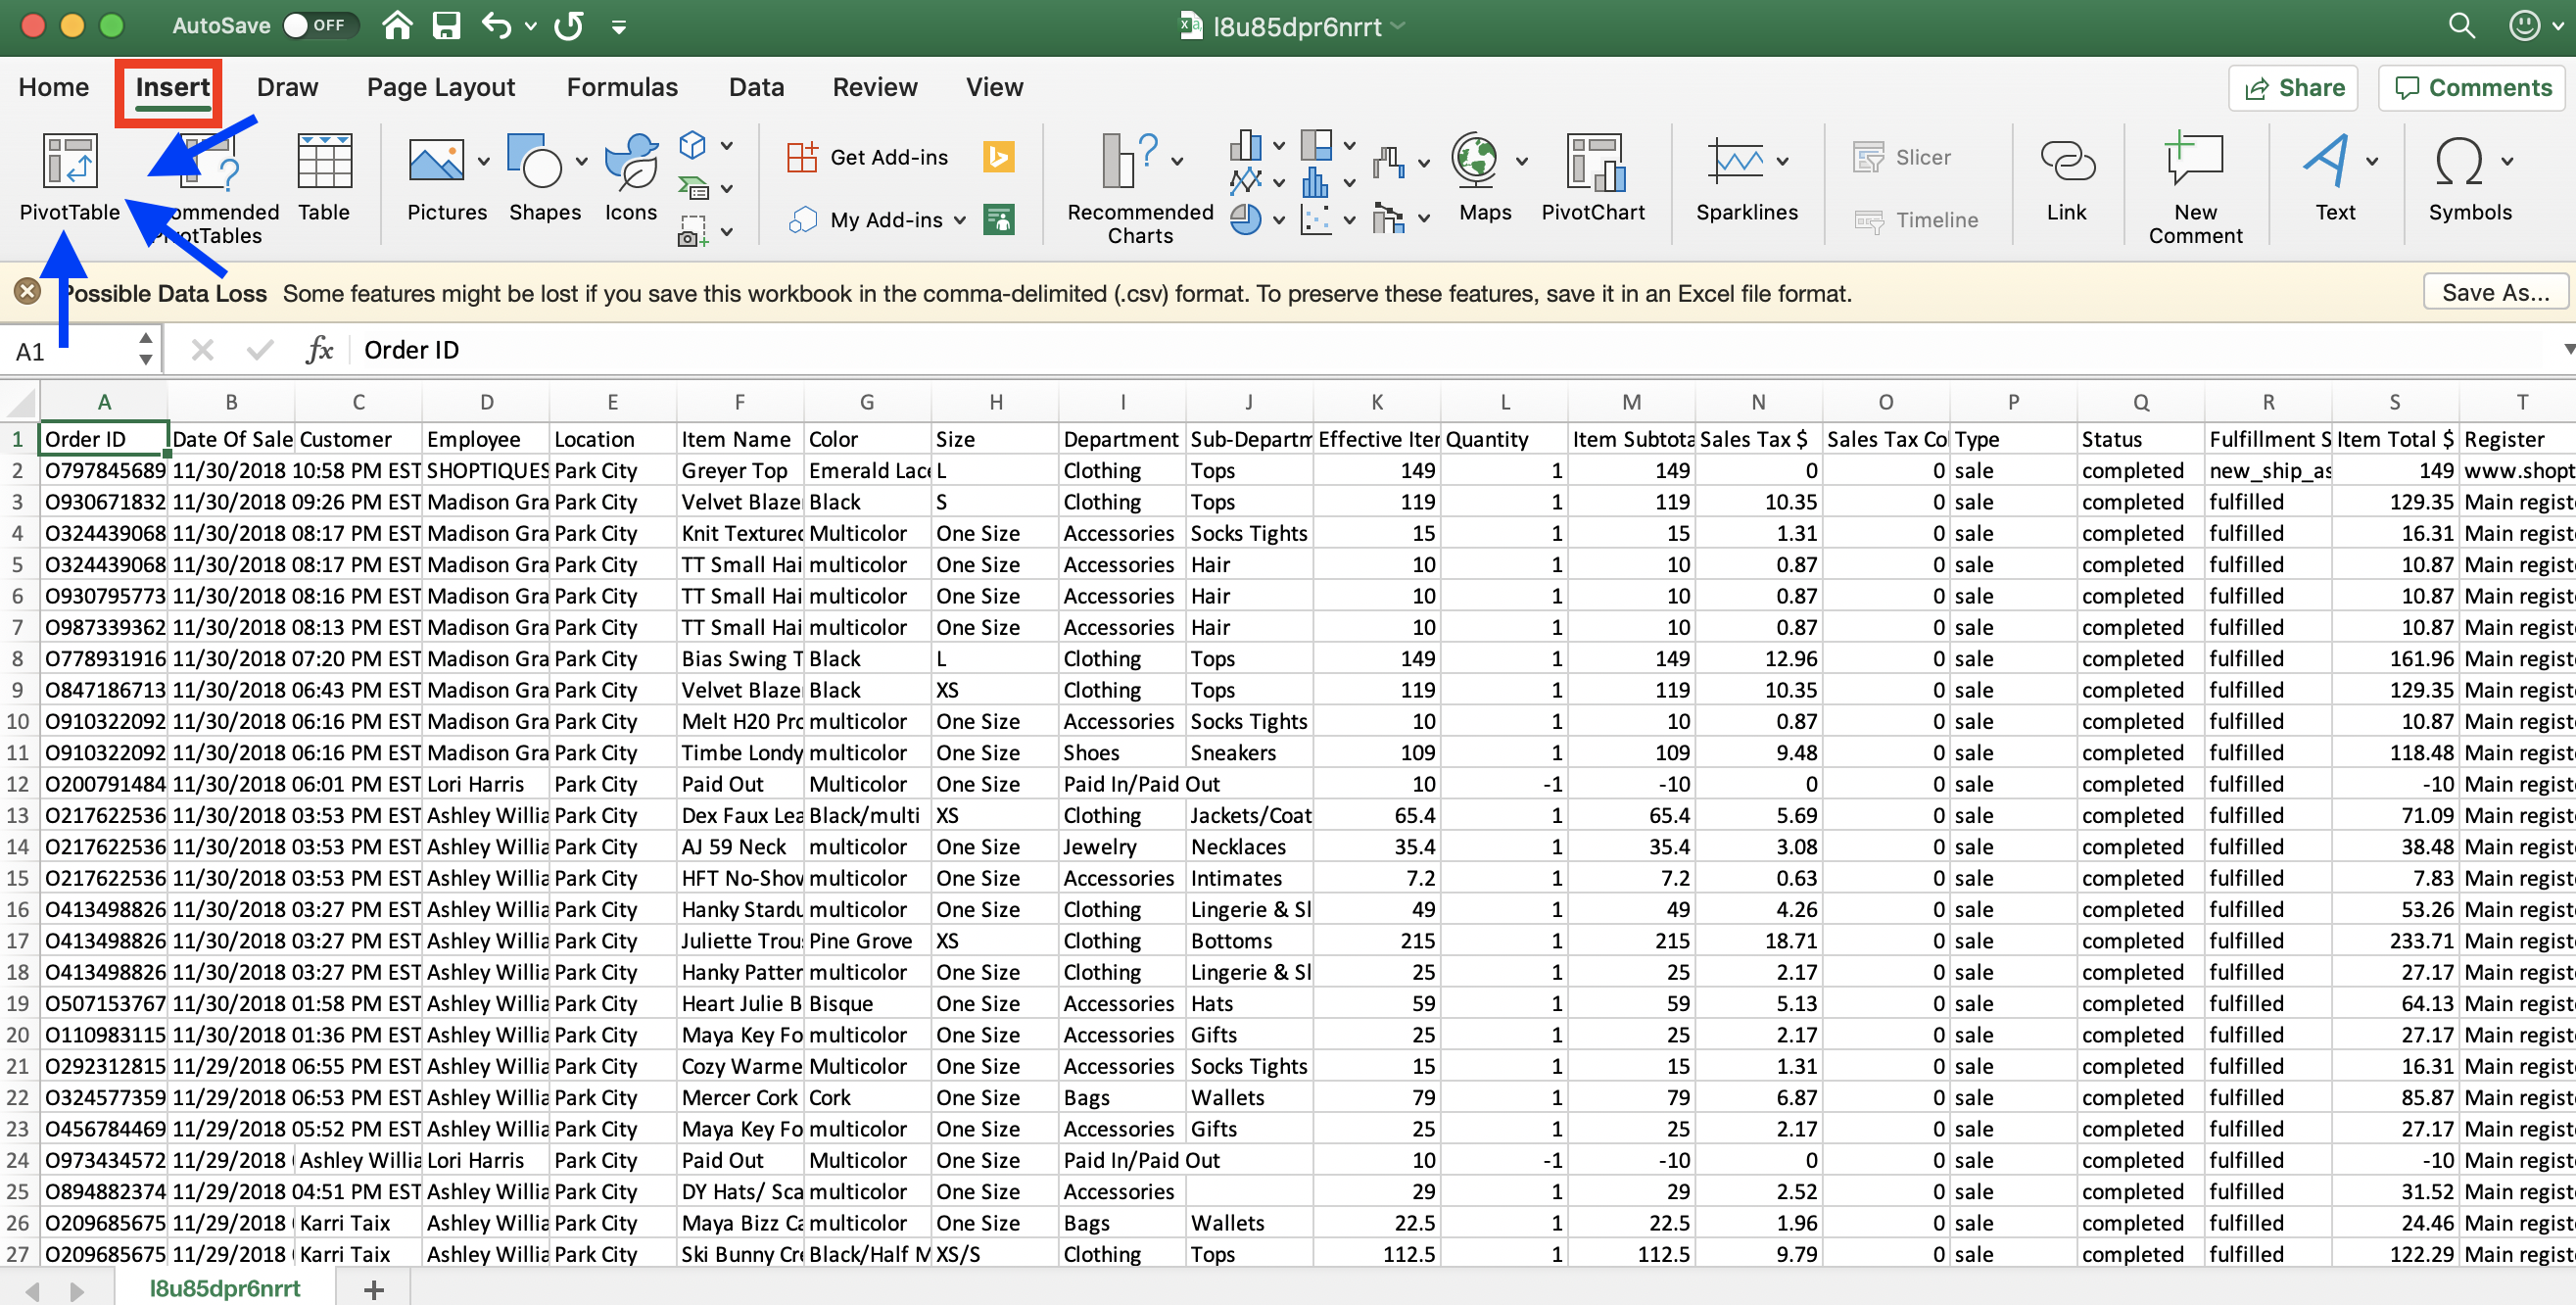
3) Open the export in excel, click to open the "Insert" tab (to the right of the "Home" tab), and then click on the pivot table icon ![]()
4) Click "select a table or range" and then "new worksheet" to create the table.

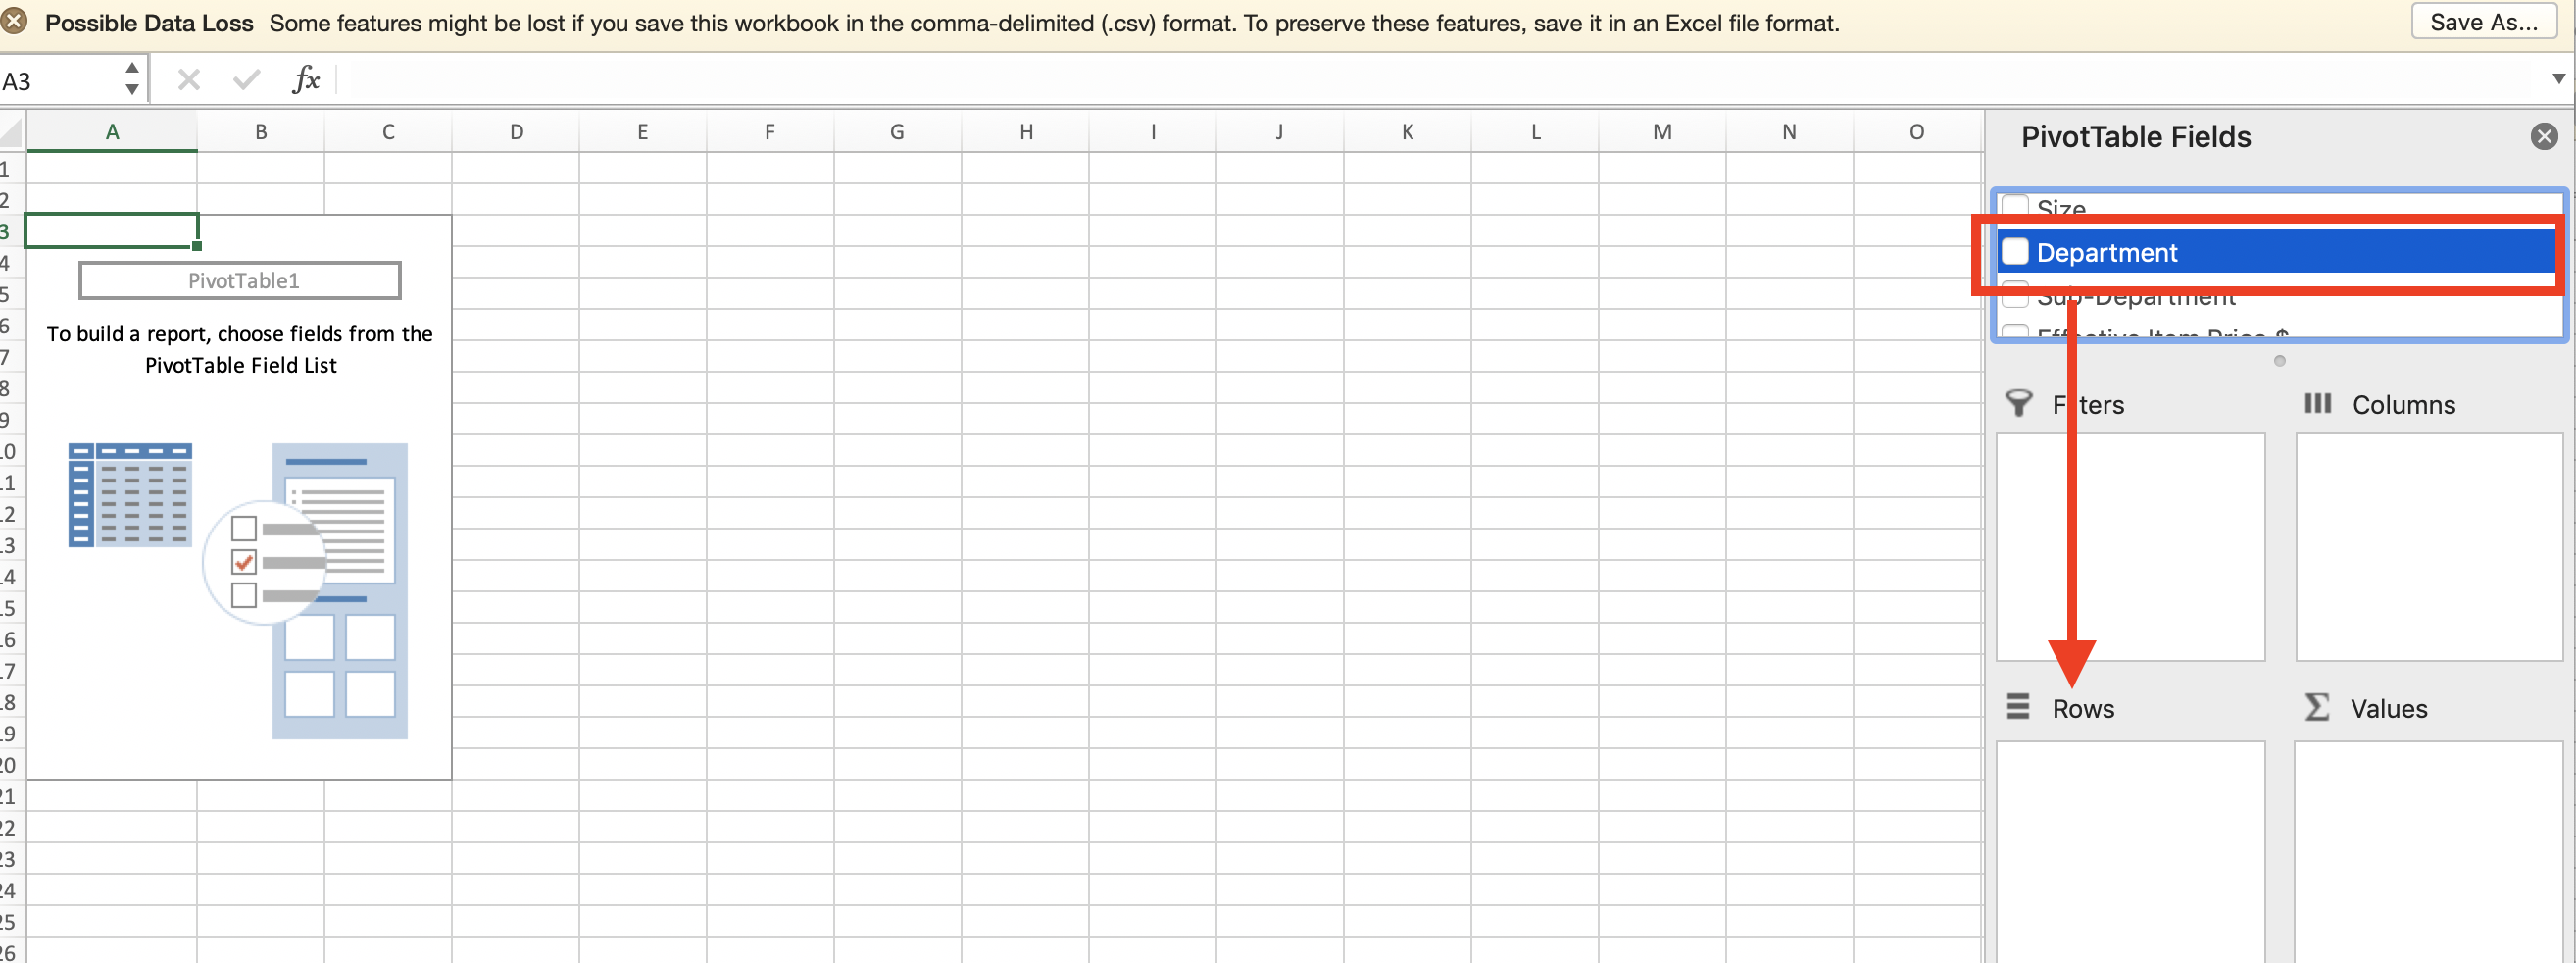
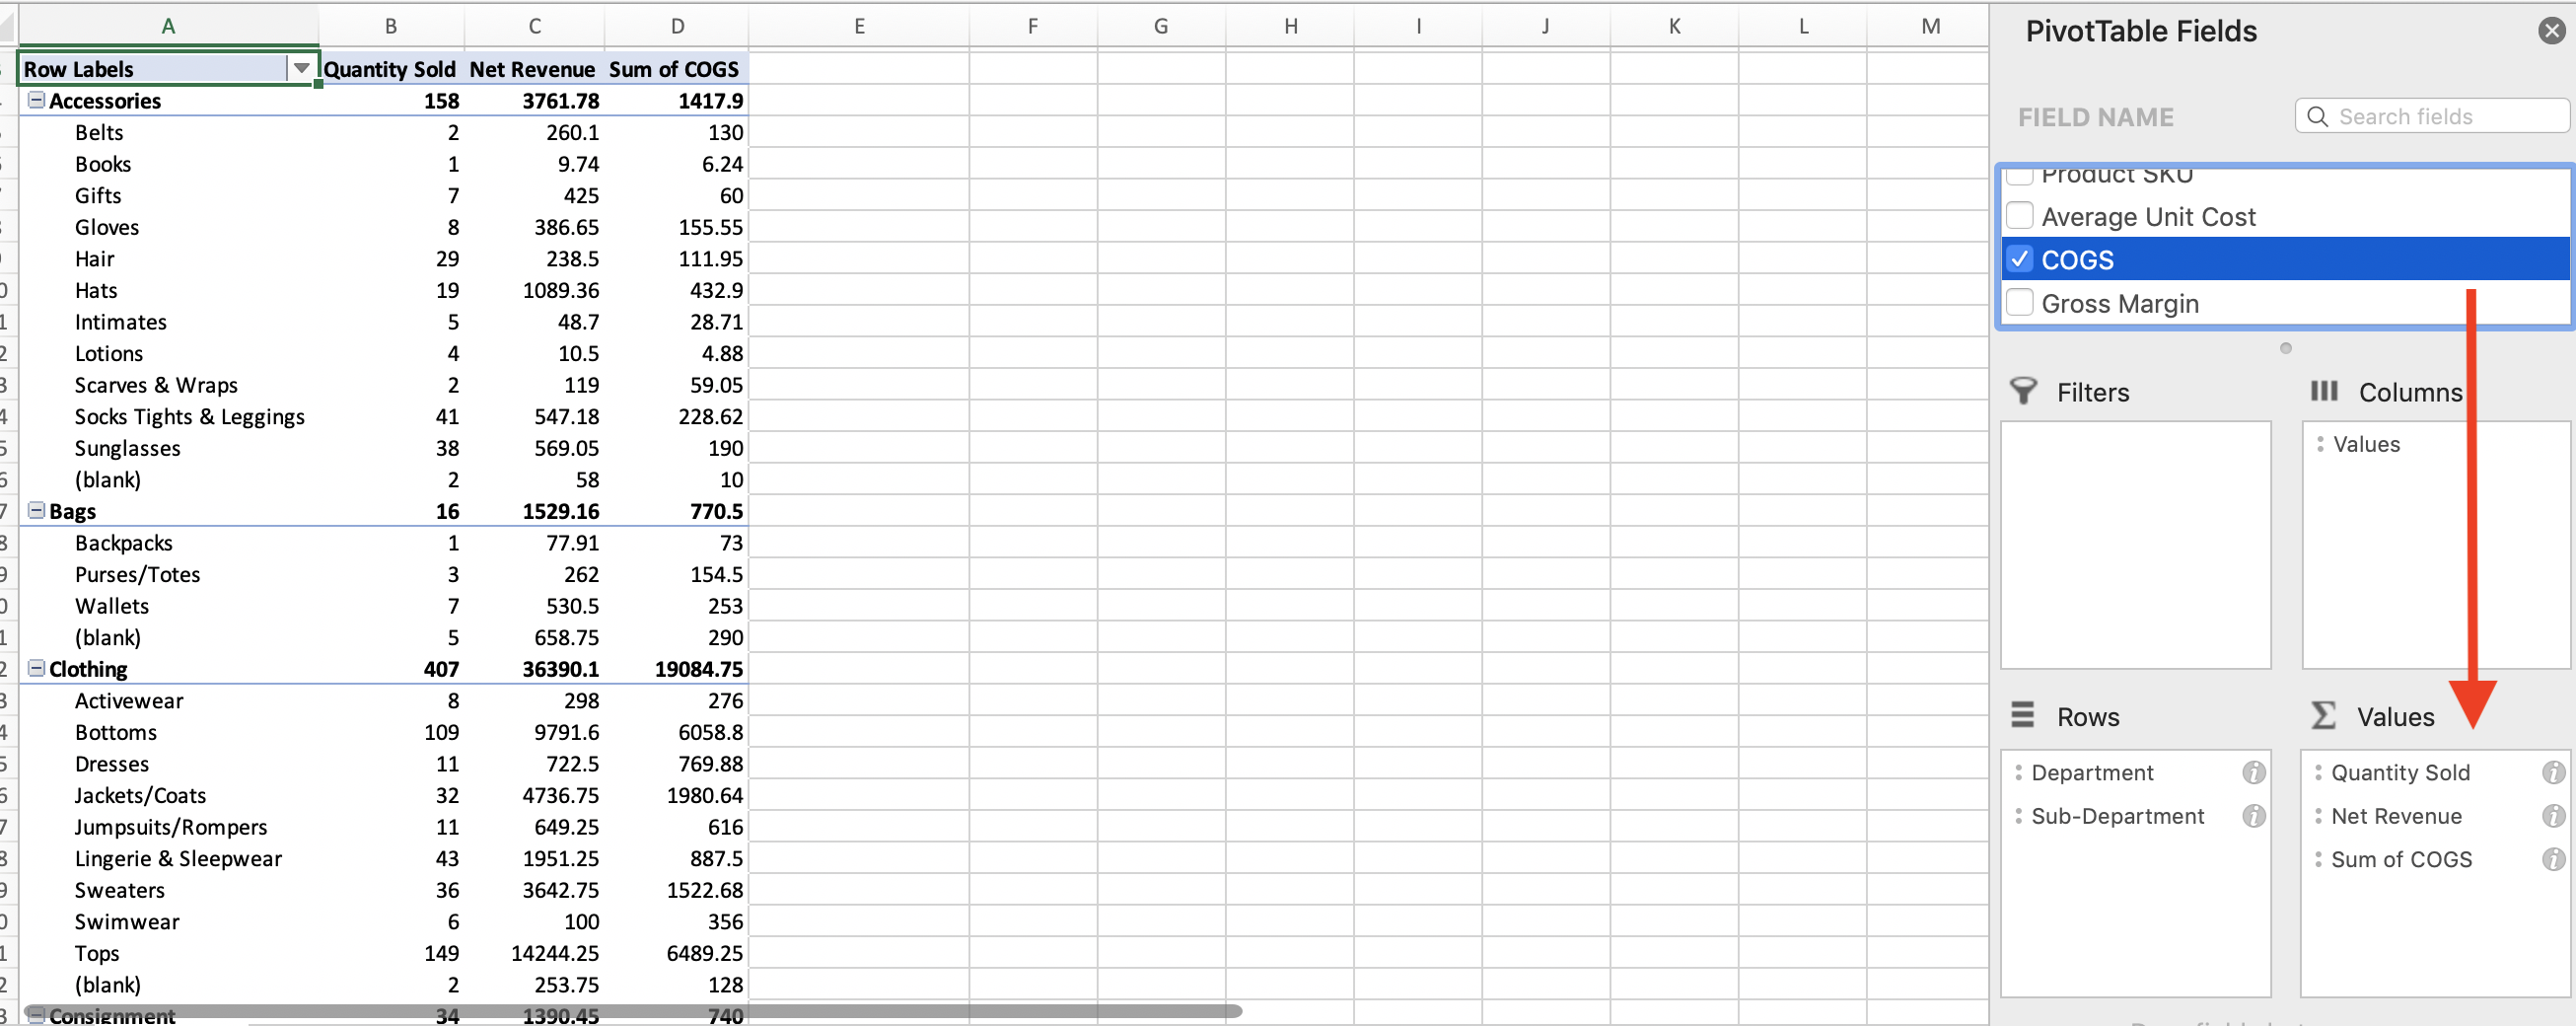
5) From there, you can build your custom report based on what columns you want to include. To start, click the box next to "department" to select it from the field name list and then drag it down to "Rows"
6) Next, select the fields (i.e. Quantity, Item Total, Wholesale Cost) from the list and drag them into the "Values" box in the bottom right. Your report will start to fill in for you automatically.
Comments
0 comments
Please sign in to leave a comment.